Food Environment Research
Our lab advances food environment research by placing humans at the center, examining behaviors such as daily mobility and perceptions as proxies for real-world food exposure and drivers of long-term health outcomes. Beyond research, we develop policy-relevant food environment measures and open-access GIS tools to help researchers and policymakers assess the status quo and design more equitable health policies.
Retail Food Activity Index
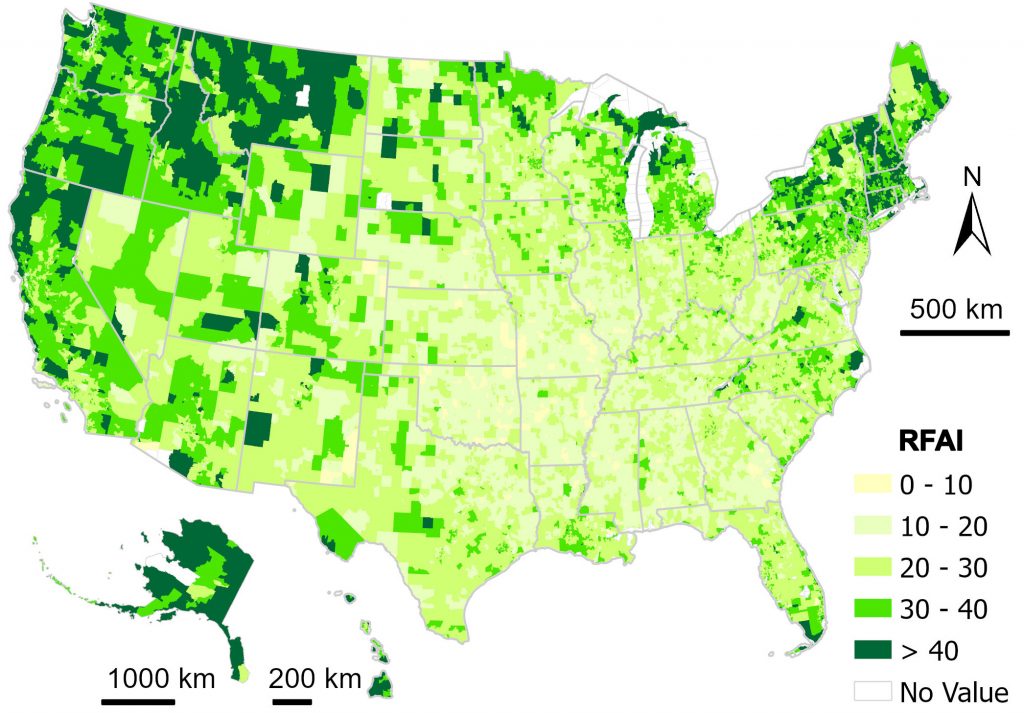
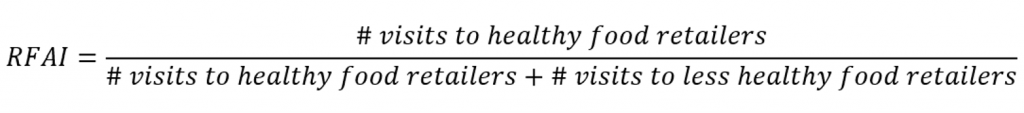
The Retail Food Activity Index (RFAI) is an aggregate measure of the healthiness of food procurement activities within a community. It is calculated as the ratio of total visits to healthy food retailers to the total visits to all food retailers within census tracts across the United States. This index is developed using nationwide GPS-based human mobility data.
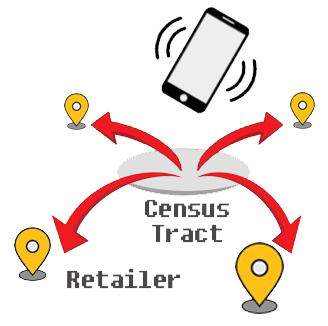
The RFAI is conceptually similar to the CDC’s Modified Retail Food Environment Index (mRFEI), which measures the percentage of healthy food retailers within census tracts. However, unlike the mRFEI, the RFAI is based on the food purchasing behaviors of residents within a census tract, capturing visits that may extend beyond their residential areas. Thus, the RFAI reflects the healthiness of people’s food procurement behaviors rather than the availability of healthy food options in their communities.
As a behavior-based index at a national scale, the RFAI has significant health implications. Our research shows that the RFAI is strongly correlated with key dietary health outcomes, such as obesity and high blood pressure. These associations make it a promising tool for informing policy initiatives and guiding targeted health interventions.
Recommended Citation (APA):
Xu, R., Huang, X., Zhang, K., Lyu, W., Ghosh, D., Li, Z., & Chen, X. (2023). Integrating human activity into food environments can better predict cardiometabolic diseases in the United States. Nature Communications, 14(1), 7326.
Modified Retail Food Environment Index (2018–2019)
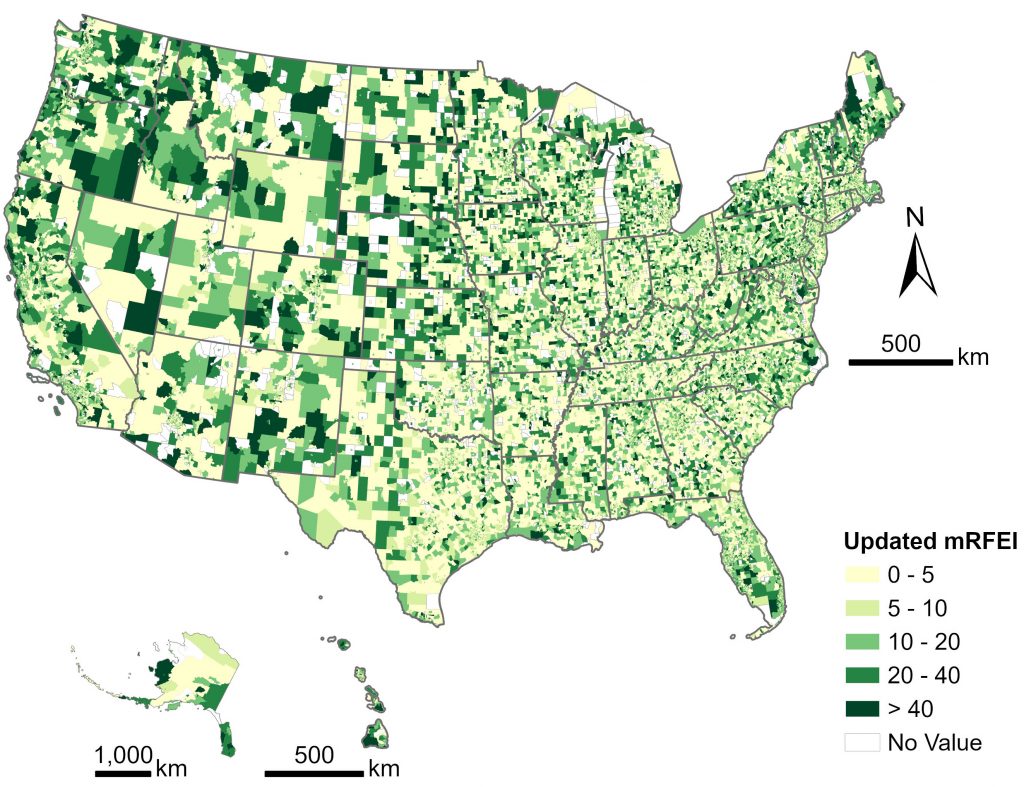
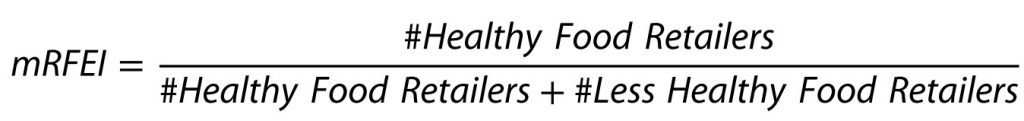
The CDC’s Modified Retail Food Environment Index (mRFEI) is a national measure used to assess disparities in food access. The index quantifies the percentage of relatively healthy food retailers compared to the total number of food retailers within a census tract, based on 2008–2009 datasets.
Over the past decade, significant changes have occurred in the retail food sector, particularly those driven by gentrification in local markets. These changes are not reflected in the existing mRFEI.
To address this gap, we recalculate the mRFEI for all U.S. census tracts using 2018–2019 datasets to better represent current food environment conditions. Additionally, we develop a user-friendly, web-based GIS tool to support public inquiries.
Recommended Citation (APA):
Lyu, W., Chen, X., Miao, C., Lin, Q., Xiang, X., Zhang, G., & Xu, R. (2025). Revisiting the modified Retail Food Environment Index (mRFEI): Examining food access inequities over a decade in the United States. Discover Public Health, 22(1), 318.
AI-based Food Nutrition Mapping
The consumer nutrition environment, such as the healthiness of restaurant menus, can influence consumers’ store choices and shape their dietary health. However, traditional food environment studies often fail to capture these nutritional nuances at broad spatial scales.
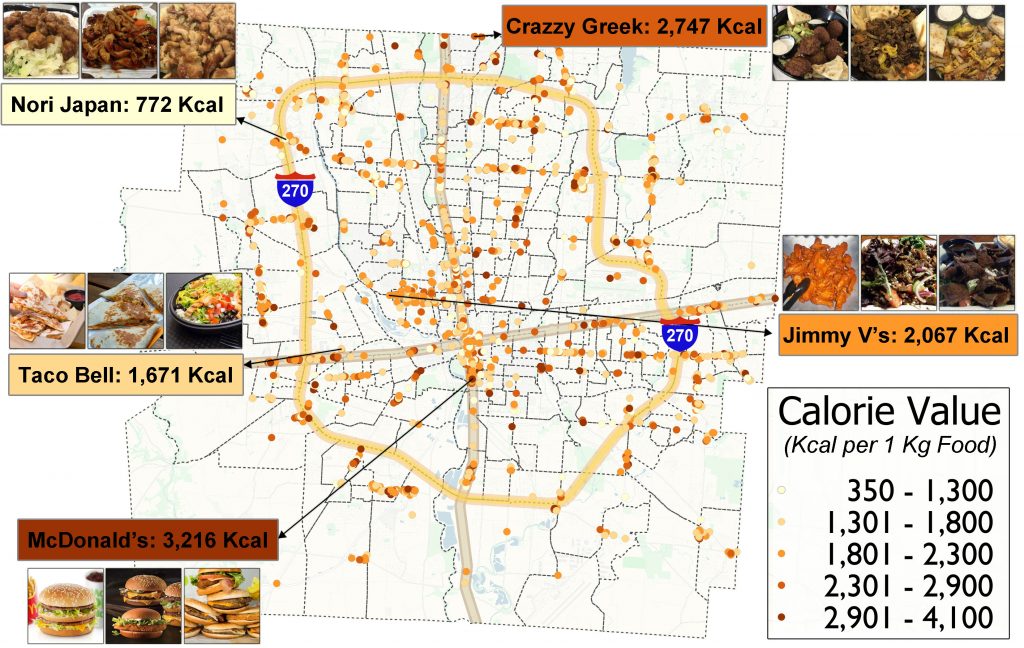
To address this gap, our team is among the first to evaluate the nutritional landscape of restaurant food environments using an AI-based image recognition model. In recent years, such models can estimate the nutrition information (e.g., carbohydrates, fats, proteins) from a food image. However, this technology has primarily been applied to individual dietary assessments.
To scale this approach up, we crowdsource online food images and link them to a restaurant directory database. We then conduct nutrition assessments for all restaurants in two US cities, Columbus and Hartford. The resulting AI-derived nutritional landscape, as a key environmental determinant of community health, helps uncover underlying patterns of food provisioning and offers new insights into the structural drivers of health inequities.
Recommended Citations (APA):
Chen, X., Zhao, B., & Yang, X. (2022). The obesogenity of restaurant food: Mapping the nutritional foodscape of Franklin County, Ohio using food review images. Applied Geography, 144, 102717.
Chen, X., Johnson, E., Kulkarni, A., Ding, C., Ranelli, N., Chen, Y., & Xu, R. (2021). An exploratory approach to deriving nutrition information of restaurant food from crowdsourced food images: Case of Hartford. Nutrients, 13(11), 4132.